Note
Go to the end to download the full example code.
Comparison to the 2.0 2D DIC Challenge
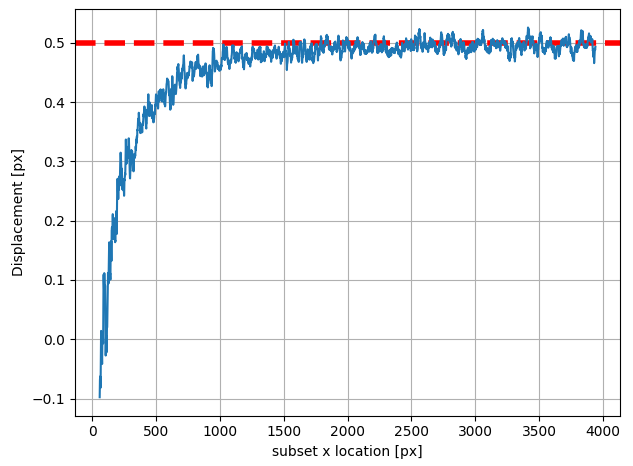
The DIC challenge provides a framework for comparison and validation of existing DIC Codes. More information can be found at https://idics.org/challenge/. In this example we look at a comparison to a image generated with ±0.5 pixel sinusoidal vertical displacement amplitude “star” pattern with varying spatial frequency. More information on the image creation can be found in the original paper. In this example we’ll look at the convergence to the peak vertical discplacement value of 0.5 pixels along a particular correlation direction.
As always, we’ll start with importing the required libraries:
import matplotlib.pyplot as plt
from pathlib import Path

# pyvale imports
import pyvale.dataset as dataset
import pyvale.dic as dic
There’s a pair of DIC challenge images that come as part of the Pyvale install. We can preload them with:
ref_pattern = dataset.dic_challenge_ref()
def_pattern = dataset.dic_challenge_def()
subset_size = 17
we need to select our region of interest. For this example, we are only
interested in the subsets along the mid horizontal line.
We can use roi.rect_boundary() to exclude a large border region so we
only correlate along the horizontal at the midpoint for our selected subset
size
roi = dic.RegionOfInterest(ref_image=ref_pattern)
subset_radius = subset_size // 2
roi.rect_boundary(left=50,right=50,top=250-subset_radius,bottom=250-subset_radius)
roi.show_image()

# create a directory for the the different outputs
output_path = Path.cwd() / "pyvale-output"
if not output_path.is_dir():
    output_path.mkdir(parents=True, exist_ok=True)

To perform the correlation we need to select a seed point. Ideally, this is somewhere in the region where the displacements are small with low noise. Here we’ll select it to be [3500,250], which is close to the right hand boundary where the spatial frequency is lower. The results will be saved in the current working directory with a filename prefix of subset_size_19_*.txt If you are feeling adventorous you could investigate the effect of varying the subset size by placing the above and below sections in a loop.
dic.calculate_2d(reference=ref_pattern,
                 deformed=def_pattern,
                 roi_mask=roi.mask,
                 subset_size=subset_size,
                 subset_step=1,
                 seed=[3500,250],
                 max_displacement=10,
                 output_basepath=output_path)
We can import the results in the standard way
data_path = output_path / "dic_results_DIC_Challenge*.csv"
dicdata = dic.import_2d(data=data_path, layout='column',
                                 binary=False, delimiter=",")

# &&
# Finally a simple plot of the calculated displacements at y=2500. This could be
# extended and compared to other DIC engines used in the 2.0 DIC challenge. A
# link to the dataset can be found under '2D-DIC Challenge 2.0' can be found
# at `https://idics.org/challenge/ <https://idics.org/challenge/>`_
plt.figure()
plt.xlabel("subset x location [px]")
plt.ylabel("Displacement [px]")
plt.grid(True)
plt.axhline(y=0.5, color='red', linestyle='--', linewidth=4)
plt.plot(dicdata.ss_x, dicdata.v[0,:])
plt.tight_layout()
plt.show()