Note
Go to the end to download the full example code.
2D Strain and Deformation Gradient Calculations
This example follows on from the previous one. It assumes that the DIC results have already been generated in the current working directory and are ready to be used for strain calculations.
We’ll start by importing the DIC data from the previous example.
You can calculate strain directly from the DIC results. It’s not necessary to load the data beforehand — you can simply pass the filename (or pattern) to the data argument. If you used a custom delimiter or saved in binary format, make sure to specify those as well.
At a minimum, you need to specify the strain window size and the element type used within the window. The valid options for window_element are:
4 for bilinear
9 for biquadratic
The output will always include the window coordinates and the full deformation gradient tensor. If you also specify a strain_formulation, the corresponding 2D strain tensor will be included in the output.
strain.calculate_2d(data=input_data, window_size=5, window_element=4,
                    output_basepath=output_path, strain_formulation="ALMANSI")
Once the strain calculation is complete, you can import the results using
pyvale.strain.import_2d().
Be sure to specify the delimiter, format (binary or not), and layout.
strain_output = output_path / "strain_dic_results_*.csv"
straindata = strain.import_2d(data=strain_output,delimiter=",")
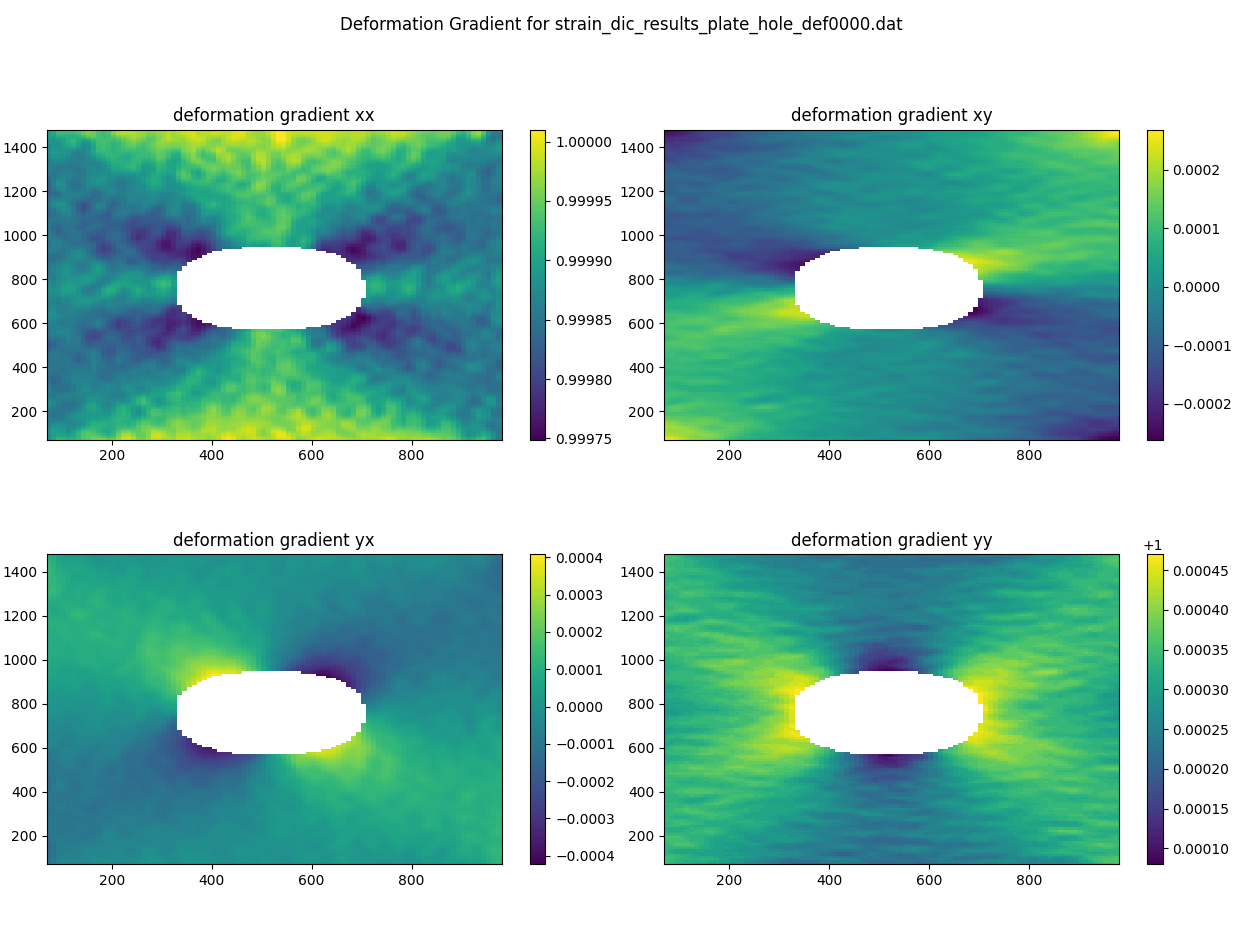
Here’s a simple example of how to visualize the deformation gradient components for the first deformation step using matplotlib. Equally, you could plot the strains using variables eps_xx, eps_xy, and eps_yy instead of the deformation gradient components below.
fig, axes = plt.subplots(2, 2, figsize=(10, 10))
axes = axes.flatten()
fig.suptitle('Deformation Gradient for ' + straindata.filenames[0])

im1 = axes[0].pcolor(straindata.window_x, straindata.window_y, straindata.def_00[1])
im2 = axes[1].pcolor(straindata.window_x, straindata.window_y, straindata.def_01[1])
im3 = axes[2].pcolor(straindata.window_x, straindata.window_y, straindata.def_10[1])
im4 = axes[3].pcolor(straindata.window_x, straindata.window_y, straindata.def_11[1])

# titles
axes[0].set_title('deformation gradient xx')
axes[1].set_title('deformation gradient xy')
axes[2].set_title('deformation gradient yx')
axes[3].set_title('deformation gradient yy')

for aa in axes:
    aa.set_aspect('equal')

# Colorbars
fig.colorbar(im1, ax=axes[0])
fig.colorbar(im2, ax=axes[1])
fig.colorbar(im3, ax=axes[2])
fig.colorbar(im4, ax=axes[3])

plt.tight_layout()
plt.show()